Reports Clients Testimonials Resources Order FAQ About
All of our reports show five years of data on every page. Thus, our reports are particularly good at revealing trends as well as program strengths and weaknesses. Our analyses and displays are valuable for teachers and administrators alike.
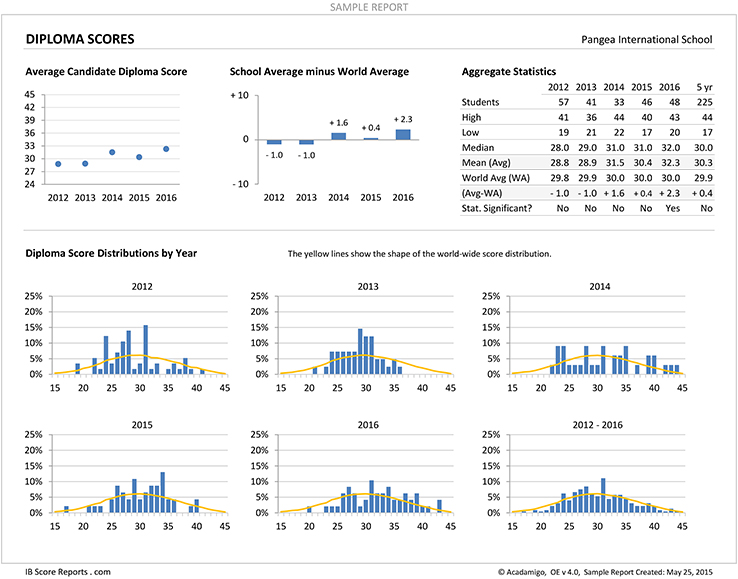
Diploma Points - Score Display
Diploma Points - Predicted vs. Awarded - Aggregate Display

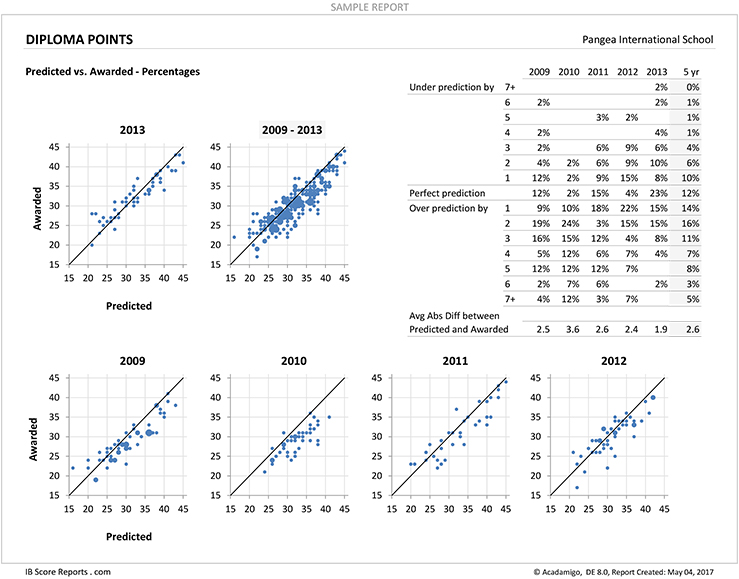
Diploma Points - Predicted vs. Awarded - Percentages Display
(An equivalent display showing counts is also included.)
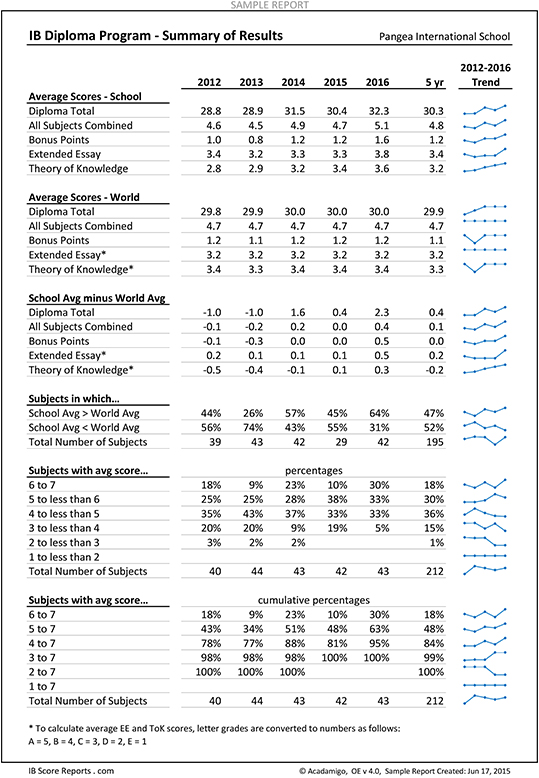
Summary Table - Diploma Program
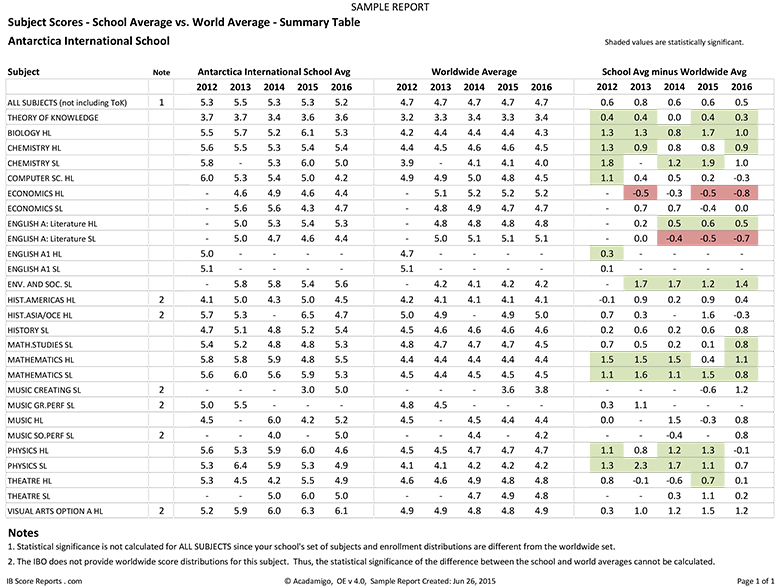
Summary Table - Subject Scores - School Avg. vs. World Avg.
showing every subject at your school
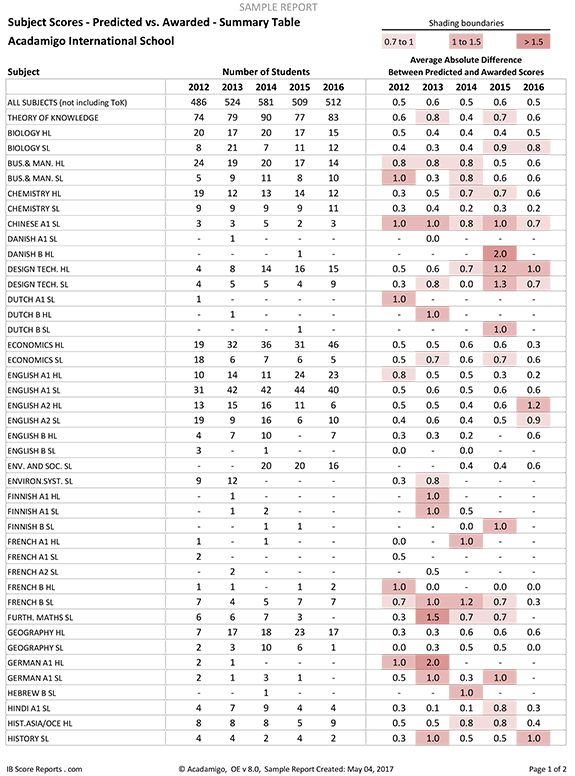
Summary Table - Subject Scores - Predicted vs. Awarded
showing every subject at your school
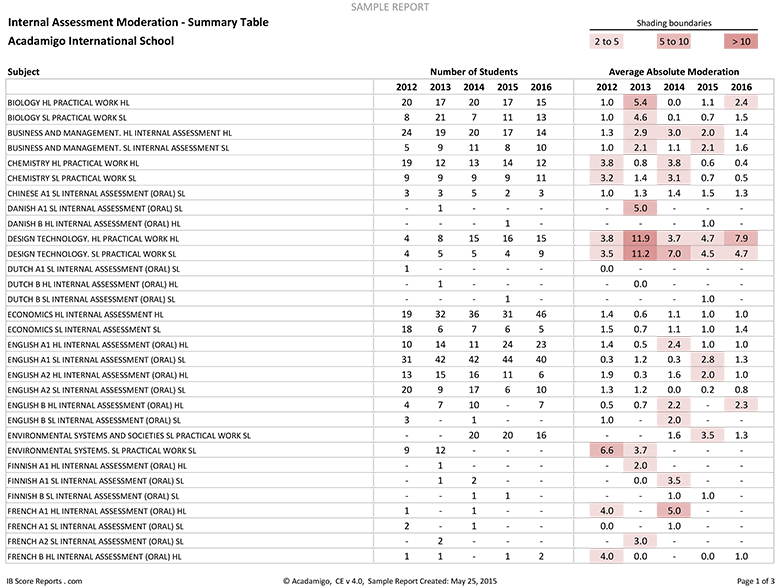
Summary Table - Internal Assessment Moderation
showing every IA for every subject at your school
Summary Table - Extended Essay
showing every EE subject at your school

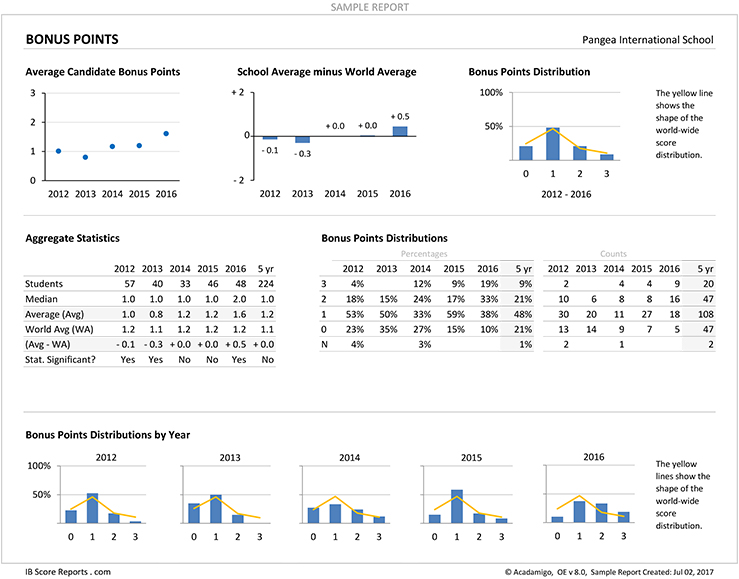
Bonus Points - Score Display
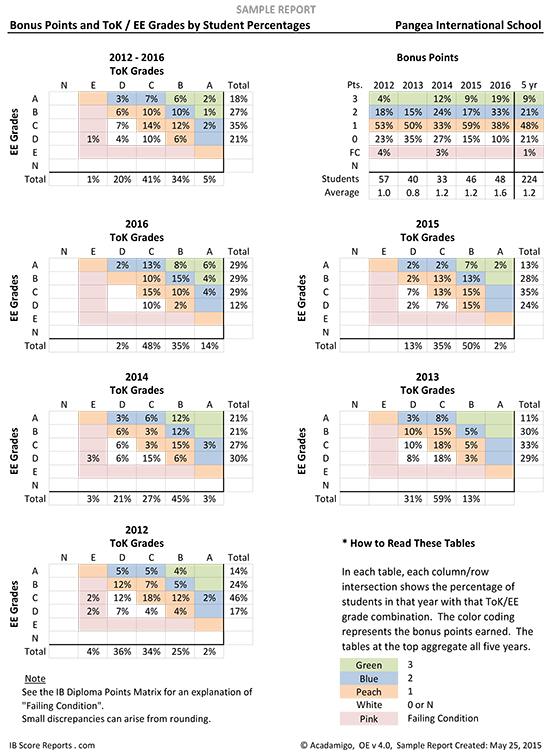
Bonus Points - TOK and EE Grade Matrices
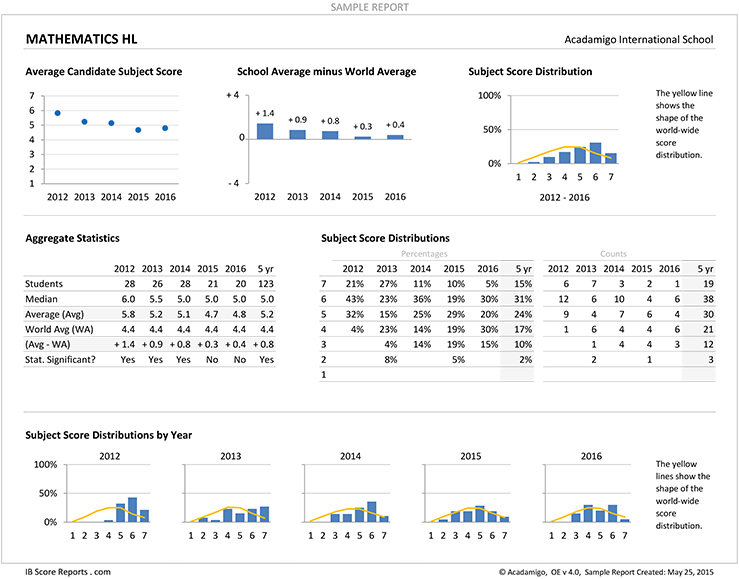
Individual Subject - Score Display
one for each subject at your school
Individual Subject - Predicted vs. Awarded Display
one for each subject at your school

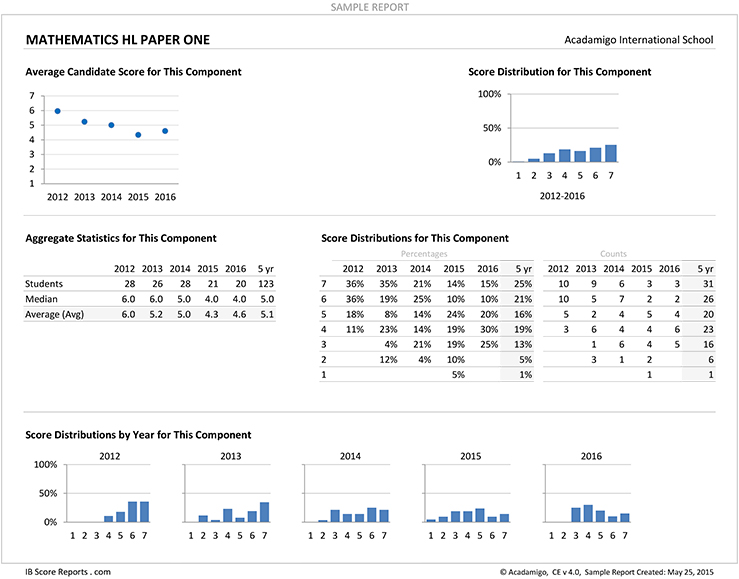
Individual Subject - Component Display
one for each component of each subject at your school
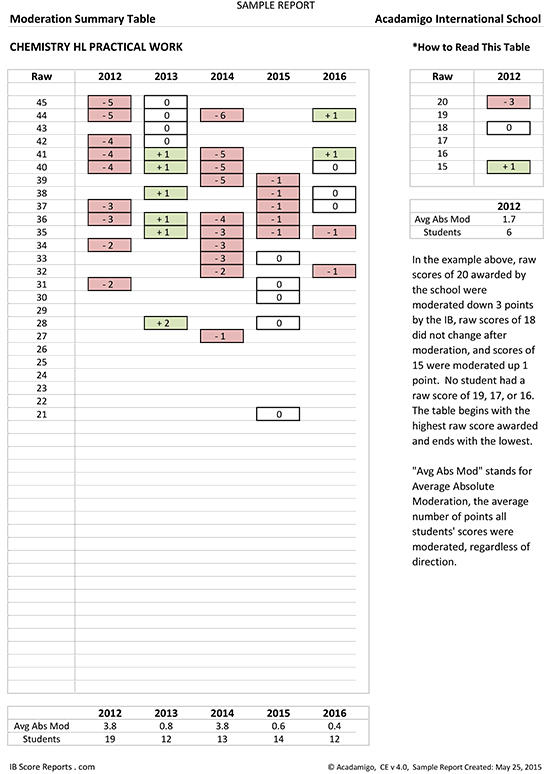
Internal Assessment - Moderation Table
one for each IA at your school
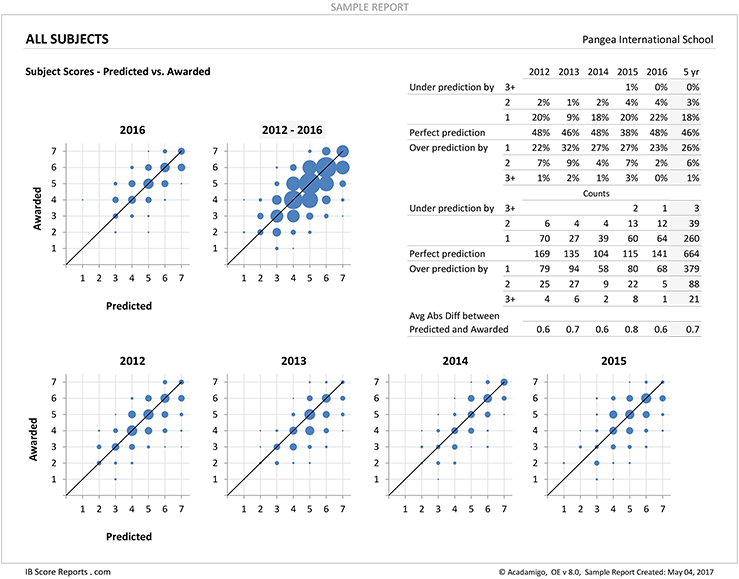
All Subjects Combined - Score Display

All Subjects Combined - Predicted vs. Awarded Display
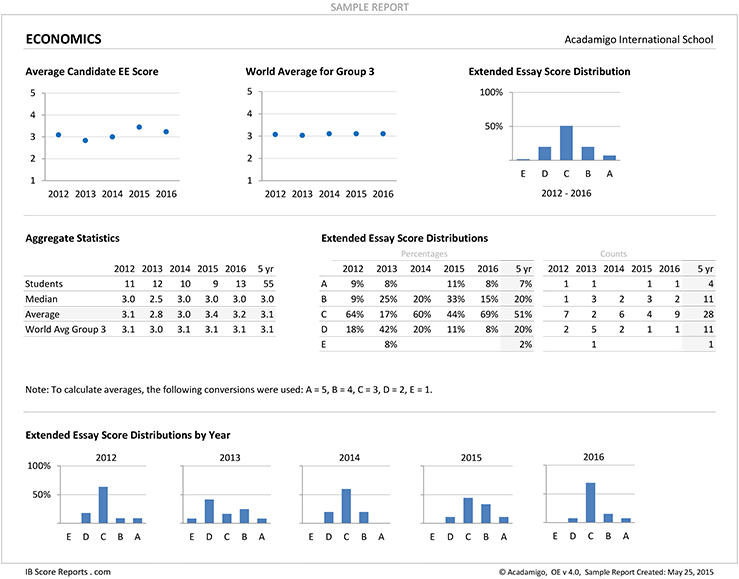
EE Subject - Score Display
one for each EE subject at your school
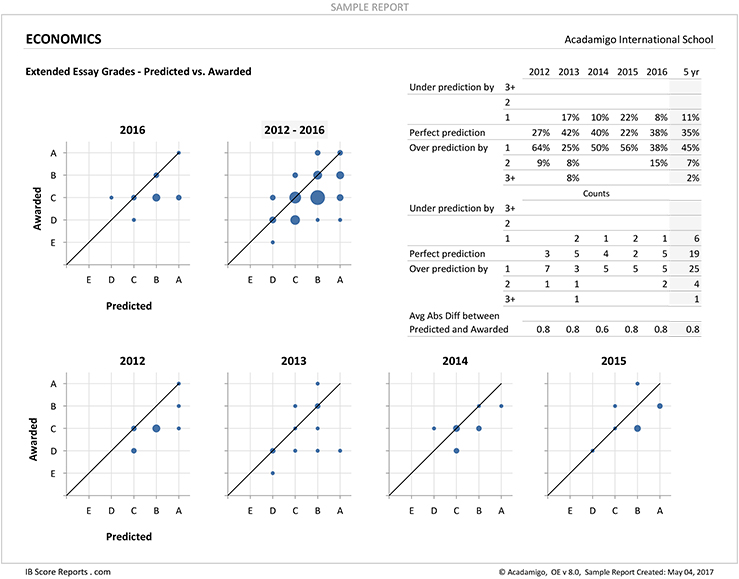
EE Subject - Predicted vs. Awarded Display
one for each EE subject at your school
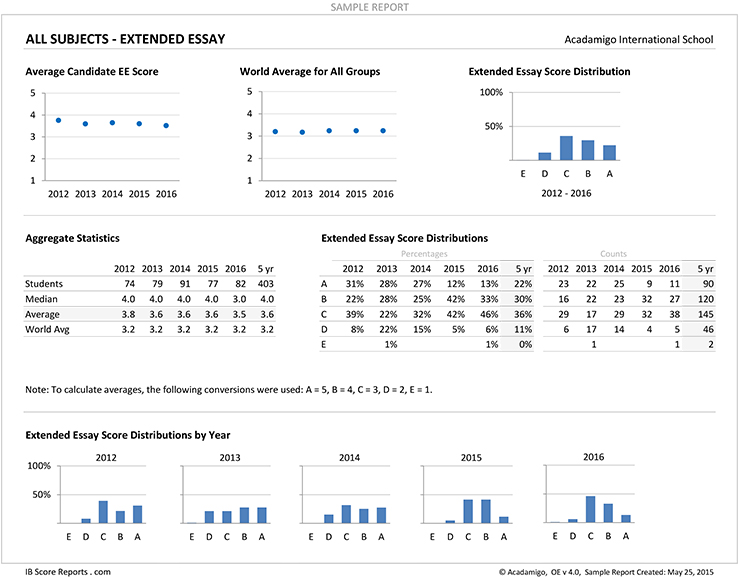
All EE Subjects Combined - Score Display
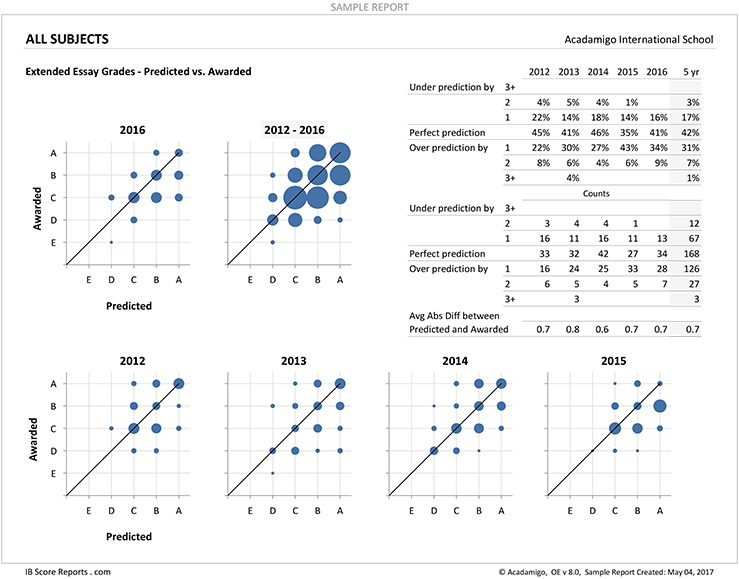
All EE Subjects Combined - Predicted vs. Awarded Display
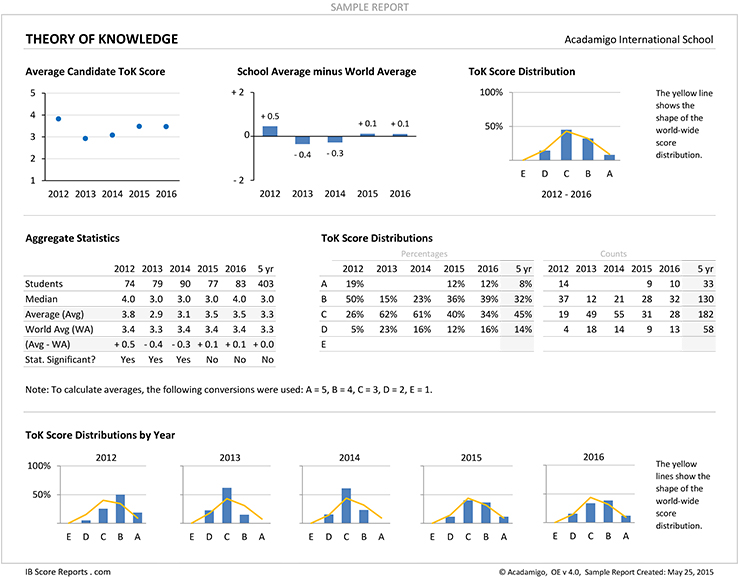
TOK - Score Display
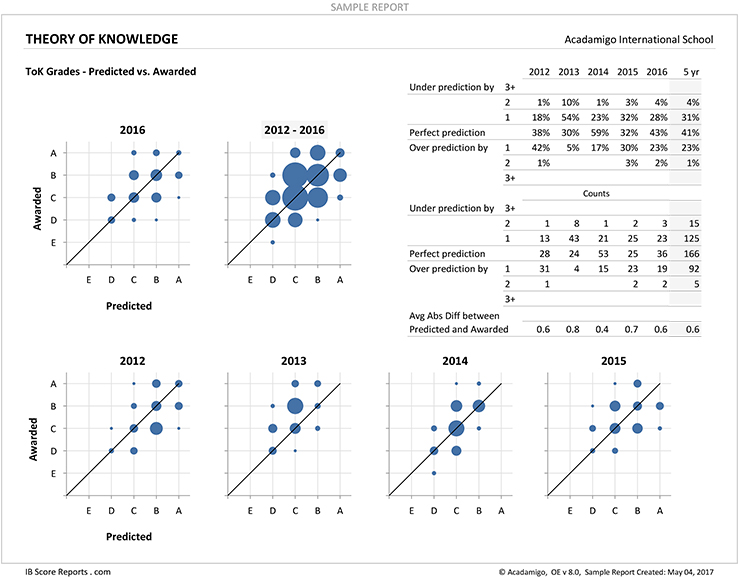
TOK - Predicted vs. Awarded Display
TOK - Component Display
one for the TOK Presentation, one for the TOK Essay

Getting started is easy. Just click here to send us an email: support@acadamigo.com