Reports Clients Testimonials Resources Order FAQ About
Teachers and coordinators often ask us how their internal assessment moderation compares with other schools.
As far as we know, the IBO does not publish worldwide statistics related to moderation.
At IB Score Reports, we see results from many different schools, so we decided to construct and share a descriptive analysis based on some of the data we have, in an attempt to help teachers and coordinators.
We encourage you to read this entire article before viewing the following table, but we're including a link here, near the top, for convenience.
Internal Assessment Moderation - 2013-2017 - 70 Schools
We created a large sample by pooling the results of 70 different schools over the last five years, 2013 through 2017. Results were gathered from each school's CSV files.
The 70 schools in this sample are the same 70 used in our previous analysis of predicted vs. awarded scores.
The 70 schools represent a wide range of programs, from well established to relatively new, from large enrollment to small. The sample includes schools from Asia, Europe, Africa, the Middle East, U.S., Canada, and elsewhere. All of the schools participated in May exams, and all had results in each of the last five years.
In our combined sample of 70 schools over five years, we have...
The primary purpose of this analysis is to serve as a resource for teachers and coordinators to compare their moderation to a large norm.
That said, we want to share a few observations that we find interesting.
Please note that in November 2015 the IB began using a new system of moderation called "dynamic sampling", and that use of that system increased in both 2016 and 2017.
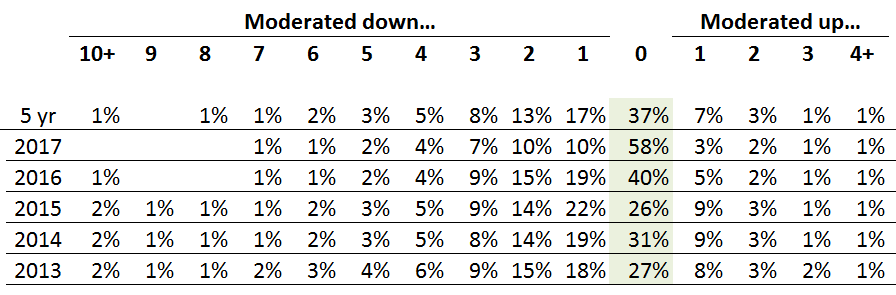
Collectively, the distributions of moderation look like this:
All Subjects - Moderation Distributions
Key Findings
Most moderation is downward.
The percentage of unmoderated scores has increased substantially in each of the last two years.
The increase in unmoderated scores from 2015 to 2016 is at least partly a function of the same, more pronounced trend in Group 4 subjects.
Biology, Chemistry, and Physics – both HL and SL – exhibited a substantial increase in the percentage of scores that were unmoderated, as well as a substantial decline in the average amount of moderation.
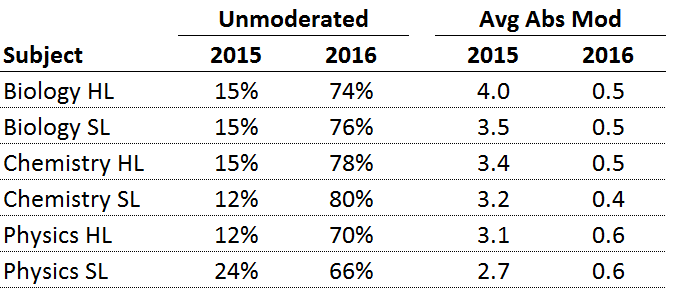
These shifts coincided with the introduction of new assessment criteria for Group 4 internal assessments, which included a decrease in the total possible points (from 48 to 24).
The increase in unmoderated scores from 2016 to 2017 is the result of the same, more pronounced trend in a variety of subjects.
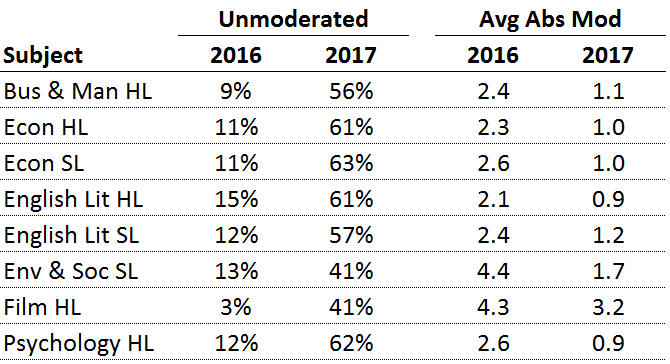
With the exception of Environmental Systems and Society, the total possible points for each of these internal assessments remained consistent between 2016 and 2017.
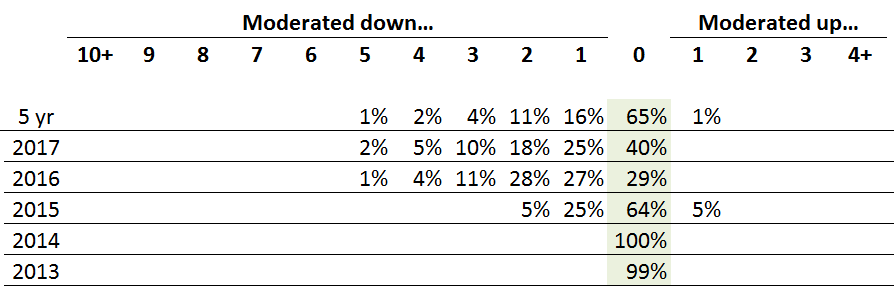
In 2016, we identified a spike in the moderation of TOK presentation scores, so let’s revisit that assessment now.
In 2015, 64% of TOK presentation scores were unmoderated, and 30% were moderated down. (5% were moderated up.)
In 2016, 29% of TOK presentation scores were unmoderated, and 71% were moderated down. (An insignificant 9 of 4,271 were moderated up.)
In 2017, moderation decreased a bit. 40% were unmoderated, and 60% were moderated down. (23 of 4,517 were moderated up.)
Theory of Knowledge - Moderation Distributions
Schools do not all offer the same subjects, and enrollments between subjects vary substantially. Generally speaking, we included subjects only when we had results from at least 100 students and 10 schools in each year.
Our filter left us with 40 course subjects, plus Theory of Knowledge. The 40 subjects are the same as those in our previous analysis of predicted vs. awarded scores.
We need to remember that when looking at different subjects, we’re not only looking at different sets of students (because students don't all take the same subjects), but also different sets of schools (because not all schools offer the same subjects).
You can see distributions and other calculated values for each of the included subjects here:
Internal Assessment Moderation - 2013-2017 - 70 Schools
These findings are intriguing, but the most important insights about moderation will come from your own school’s data.
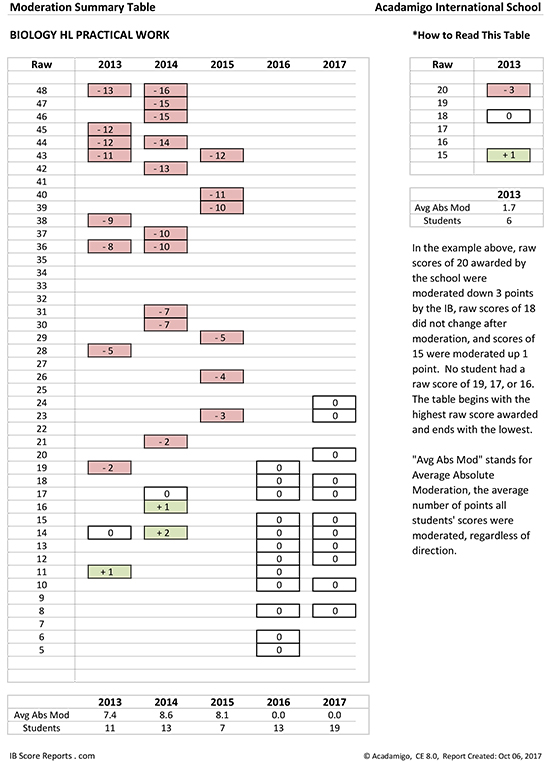
If you haven’t already, we encourage you to review moderation trends within each of your courses, including TOK. We can help with that, of course, since our report package includes moderation displays for every subject at your school, like this:
Although our sample of 70 schools is quite diverse in terms of location, enrollment, and length of offering the IB Diploma, we do not claim that it is statistically representative of all IB schools, all IB schools in any particular region, or all IB Score Reports client schools. One should be cautious about generalizing our findings. Our goal, as always, is to help teachers and schools, using the best data we have available.
Getting started is easy. Just click here to send us an email: support@acadamigo.com