Reports Clients Testimonials Resources Order FAQ About
by Michael Ortiz, IB DP Coordinator at the International School of Kuala Lumpur
In my experience sharing data with teachers, I find that some are well-versed in making sense of it, while others shy away from the numbers and graphs. While we do have a collective "IB Data" meeting at the start of our school year, I can reach teachers much more effectively with one-on-one conversations, walking through the data in a clear and systematic way, working to find the take-aways in the numbers.
Before having a one-on-one conversation with a teacher, be clear in your own mind about your goals. Consider that IB results are summative, the end result of two years of teaching and learning. In speaking with an individual teacher, we are looking back in time, in an effort to learn how to go forward.
Knowing context is essential, for both you and the teacher, so that results can be put into appropriate perspective. Perhaps you are working with a teacher new to the IB, or an experienced person teaching HL for the first time, or someone resistant to change, or a first cohort on a new syllabus, or a group of low-achieving students.
Whatever the context, the goal is the same -- helping teachers use data to inform their approach to a course this year.
Below is a suggested protocol for using data in conversation with an individual teacher. An actual case illustrates the protocol in action.
The one-on-one conversation:
Context: Experienced teacher, traditional but open-minded, new to this IB SL subject, first time with students sitting the exams in 2017. The course tends to attract lower-performing students in general.
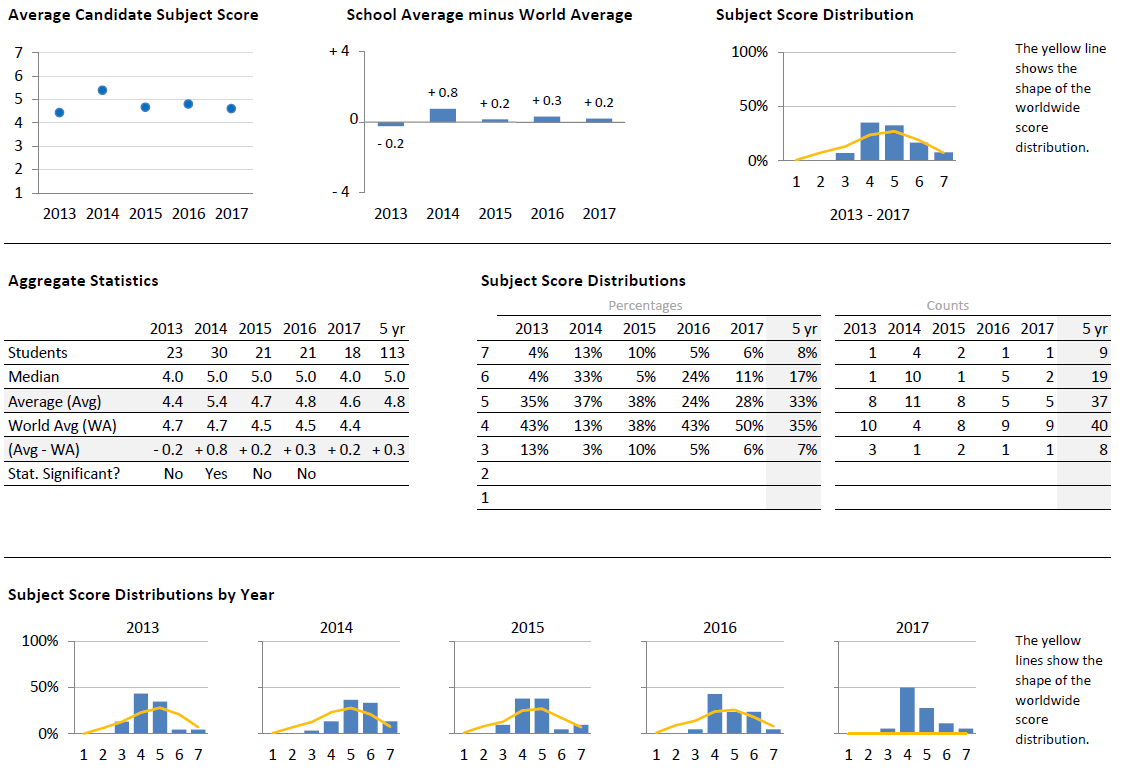
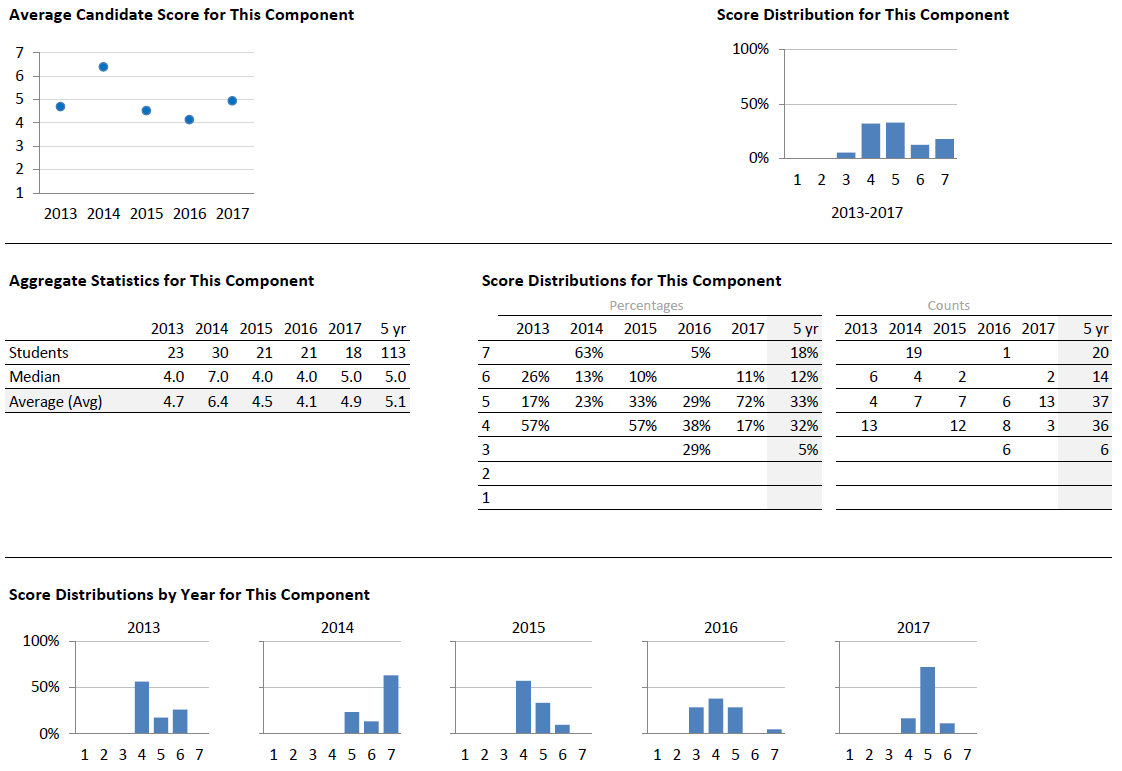
Begin by looking at the top row of charts. Over five years, the trend seems to be fairly consistent, although for whatever reason, 2014 happened to be an unusually good year. (That may be worth exploring, but not now, as this teacher is mostly concerned about 2017). The five-year distribution shows mostly 4’s and 5’s with some 6’s and 7’s that match world distributions. All-in-all not a bad result, and there are no 2’s and not so many 3’s.
Further context: there has been a different teacher of this course for each of the past five years.
Looking at the middle tables, we see the averages as in the visuals, no surprise. Yet we also see that half of the scores in 2017 are 4’s. This is higher than in previous years, and is worth noting.
Looking at the bottom row of distribution charts, we see further support that the 4’s in 2017 are higher than in the past. While 2016 had nearly as many 4’s, there seemed to be a few more 6’s in that year to balance the overall.
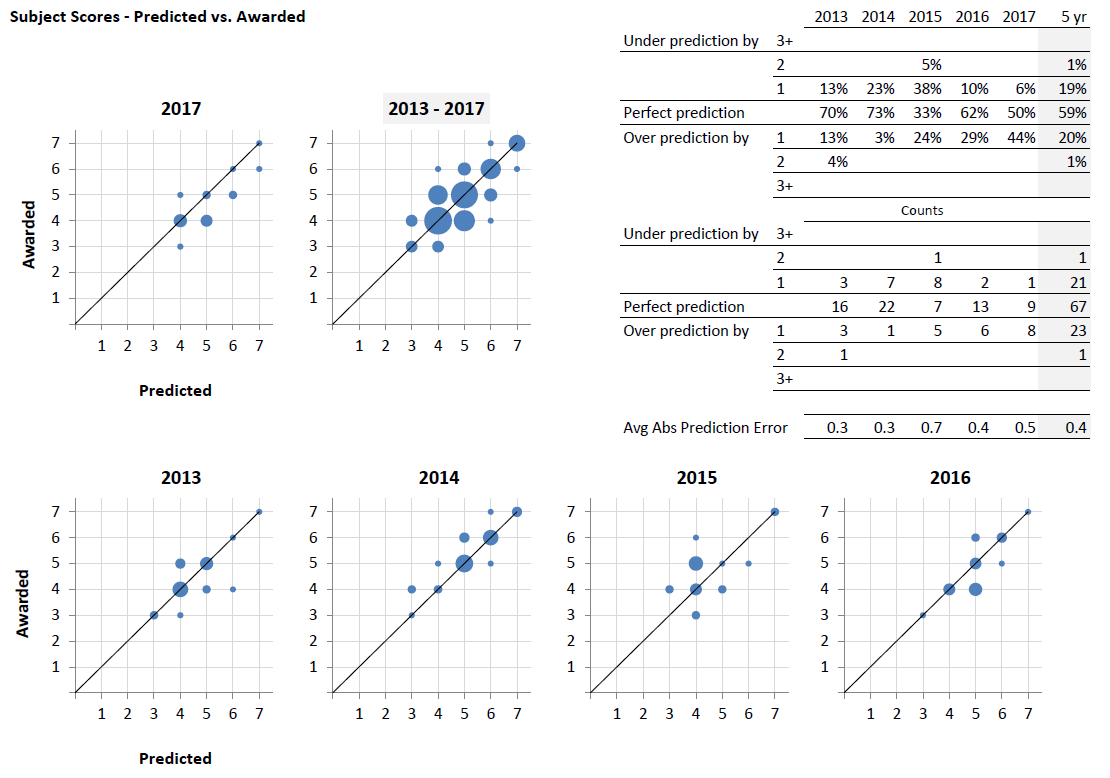
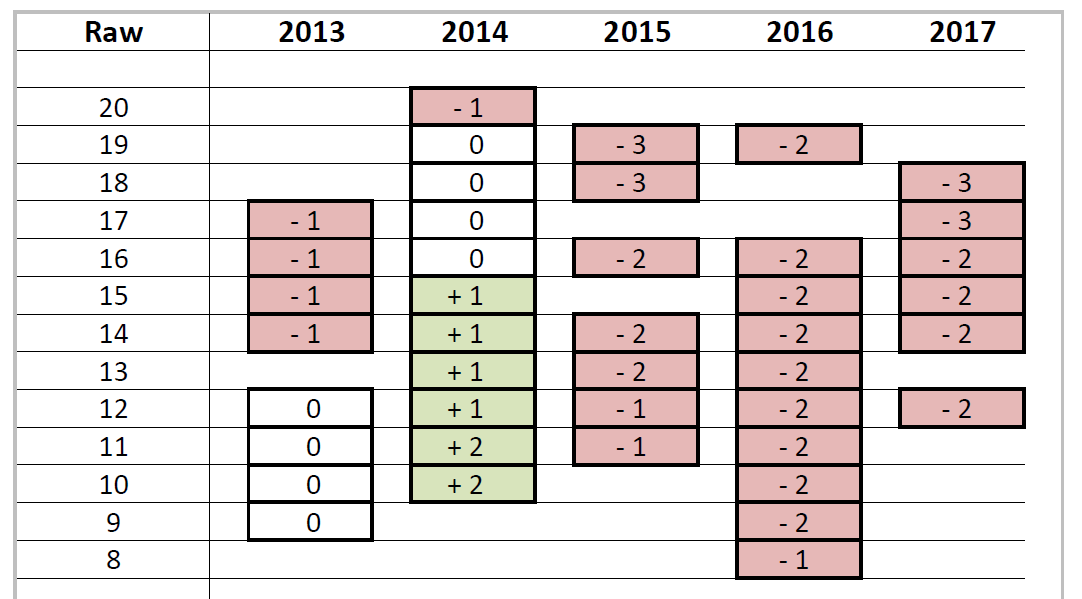
The chart for 2017 shows a clear lean toward over-predicting, for which numerical evidence offers further support: in 2017, 44% of scores were over-predicted. This is not unexpected of a teacher for whom this is a first cohort of students siting an IB exam. Noteworthy is that all over-predictions are by one point, and that there is only one under-prediction.
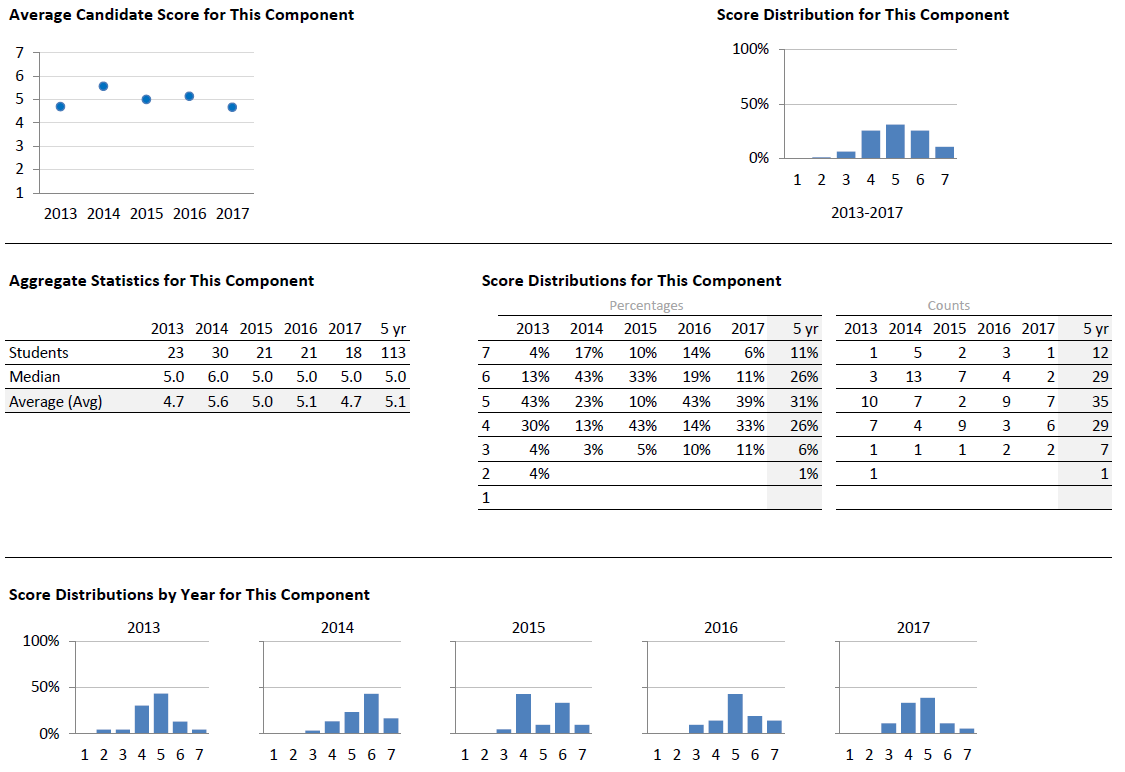
Looking at top left chart, we see that the average for Paper 1 is slightly down from previous years, matching that of 2013.
Looking at the middle table, we see a higher percentage of 4’s and 5’s in 2017 than in the five-year total, which is somewhat consistent with the overall distributions.
Looking at the bottom row of distributions, noteworthy is 2015, which shows that the overall average is somewhat deceptive, divided into “haves” and “have-nots” with more 4’s and 6’s, and not so many 5’s.
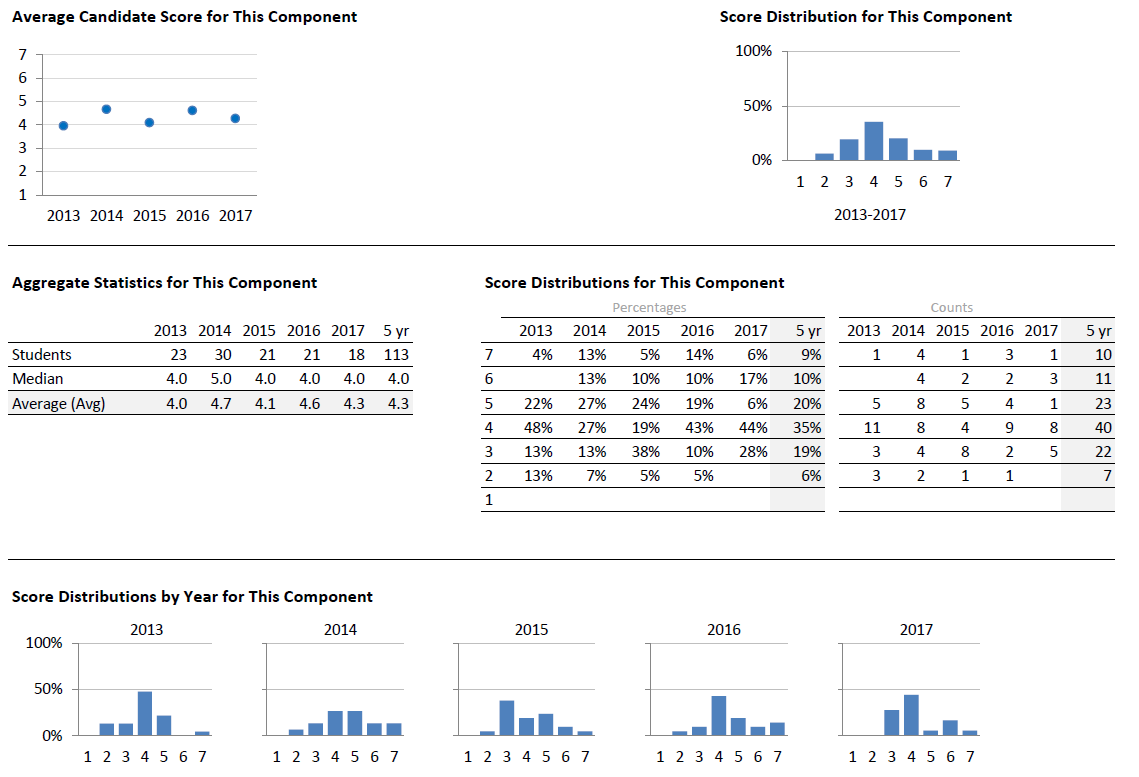
Paper 2 has an odd oscillating history, and the 2017 average is not out of line.
In the middle table, we see a number of 3’s in 2017, nearly 30% of the students, which is something not seen in the overall or in Paper 1. A few students have earned a 6 or 7, which is why the averages are not pulled down by much, but such a collection of 3’s and 4’s suggests something may be amiss with Paper 2.
The visual distributions in the bottom row lend further support to the idea that most students in 2017 struggled with Paper 2, with only a few being highly successful. The lack of 5’s is noteworthy, and is perhaps another case of “haves” and “have nots” in this paper.
In conversation, the teacher expressed some disappointment with results of the IA, due to being moderated. Already understanding that 2014 had something special going on, the comparisons with other years show 2017 to be a pretty good year for IA results.
Looking at the distributions in the bottom row, 2017 performance on the IA was quite solid, better than all years except 2014, which naturally leads to the question of moderation.
Historically, it is not unusual for some downward moderation for the IA in this subject, even with multiple teachers represented. While moderation can be due to statistical variation, for the purposes of this present conversation, the 2017 higher scores moderated down 3 on a 20-mark IA suggests the teacher is interpreting the rubric more generously than IB moderators. This is consistent with over-predicting the scores in general, and not unexpected from a first-time teacher of the subject.
Despite these moderations, students scored well in their IA work, which may have countered the performance in Paper 2.
Here we had a conversation that both summarizes what we see in the data, and what might be some considerations as the teacher begins work with the 2017-2019 cohort and with students in their second year preparing for their exams next May.
We see a course whose students performed on par with world expectations, achieved solid results on the IA, adequate results in Paper 1, and struggled with Paper 2. These Paper 2 results are particularly interesting, as some students scored quite well, however the number of 3’s and 4’s suggests lower performing students have difficulty accessing the questions.
How do we improve learning in Paper 2?
Equipped with this insight, a discussion ensued about how to more effectively approach the teaching and learning of Paper 2 expectations. In terms of what a student must do to be generally successful, we identified five attributes unique to the design of the assessment. Further discussion focused on the challenge for students to show their knowledge and understanding under these expectations, and possible ways for the teacher to deliver long-term classroom experiences that will help students improve their approach. Therein lies the take-away.
Getting started is easy. Just click here to send us an email: support@acadamigo.com